ASKTERRA Pricing
Transparent, flexible pricing built on the Cloud Data Unit (CDU) model.
Welcome to ASKTERRA, where our goal is to provide a transparent and flexible pricing model that scales with your needs. Our unique approach is centered around the Cloud Data Unit (CDU), a proprietary metric designed to represent the total resources consumed by your activity on the ASKTERRA platform. As you explore your own usage needs within the application, our Cloud Data Packages offer flexible credit consumption, from our free 7-day trial, to our tiered CDU plans. The cost of cloud services and AI technology can be difficult to track and understand, spurring the need to provide users with real-time monitoring and transparency tools to manage costs and maximize the value that ASKTERRA can offer.
In the table below you can review ASKTERRA packages available for purchase.
Pricing Structure for ASKTERRA (Cloud Data Unit Model)
This model offers a predictable base subscription with a precise, transparent usage-based component. Volume based plans make it easier to choose the right package for your teams needs and offer discounted rates on CDUs for heavy users without the need to track licenses or add seats among multiple users. Simply purchase and consume the credits your workflows and teams require:
| Tier | Platform Fee (one time) | Included Cloud Data Units (CDUs) | Ideal For |
|---|---|---|---|
| 7-day Free Trial | FREE | 500 CDUs | Ideal for new users curious to explore ASKTERRA and learn how it can augment their insights about the world. |
| Cloud Data Package Tier 1 | $99.00 | 5,000 CDUs | Ideal for exploring workflows and understanding how to use ASKTERRA. A great place to start leveraging GeoAI and increasing your remote sensing and GIS efficiency. . |
| Cloud Data Package Tier 2 | $249.00 | 15,000 CDUs | Ideal for GIS teams that consistently need Geospatial insights and perform production style processes. |
| Cloud Data Package Tier 3 | $499.00 | 30,000 CDUs | Ideal for larger teams and more complex workflows, many users and extensive data consumption. |
Transparent Data Tracking Dashboard: Which provides users a real-time, in-app dashboard that shows:
- Large Language Model (LLM) credit consumption
- Google Earth Engine credit consumption
- Total combined CDU usage
- Per query consumption rates
- Download and Export tracking
The Dashboard interface allows users to better understand their ASKTERRA usage and consumption habits, allowing for efficient calibrations of workflows and prompting strategies.

Below we walk you through some common use cases and the associated CDU consumption:
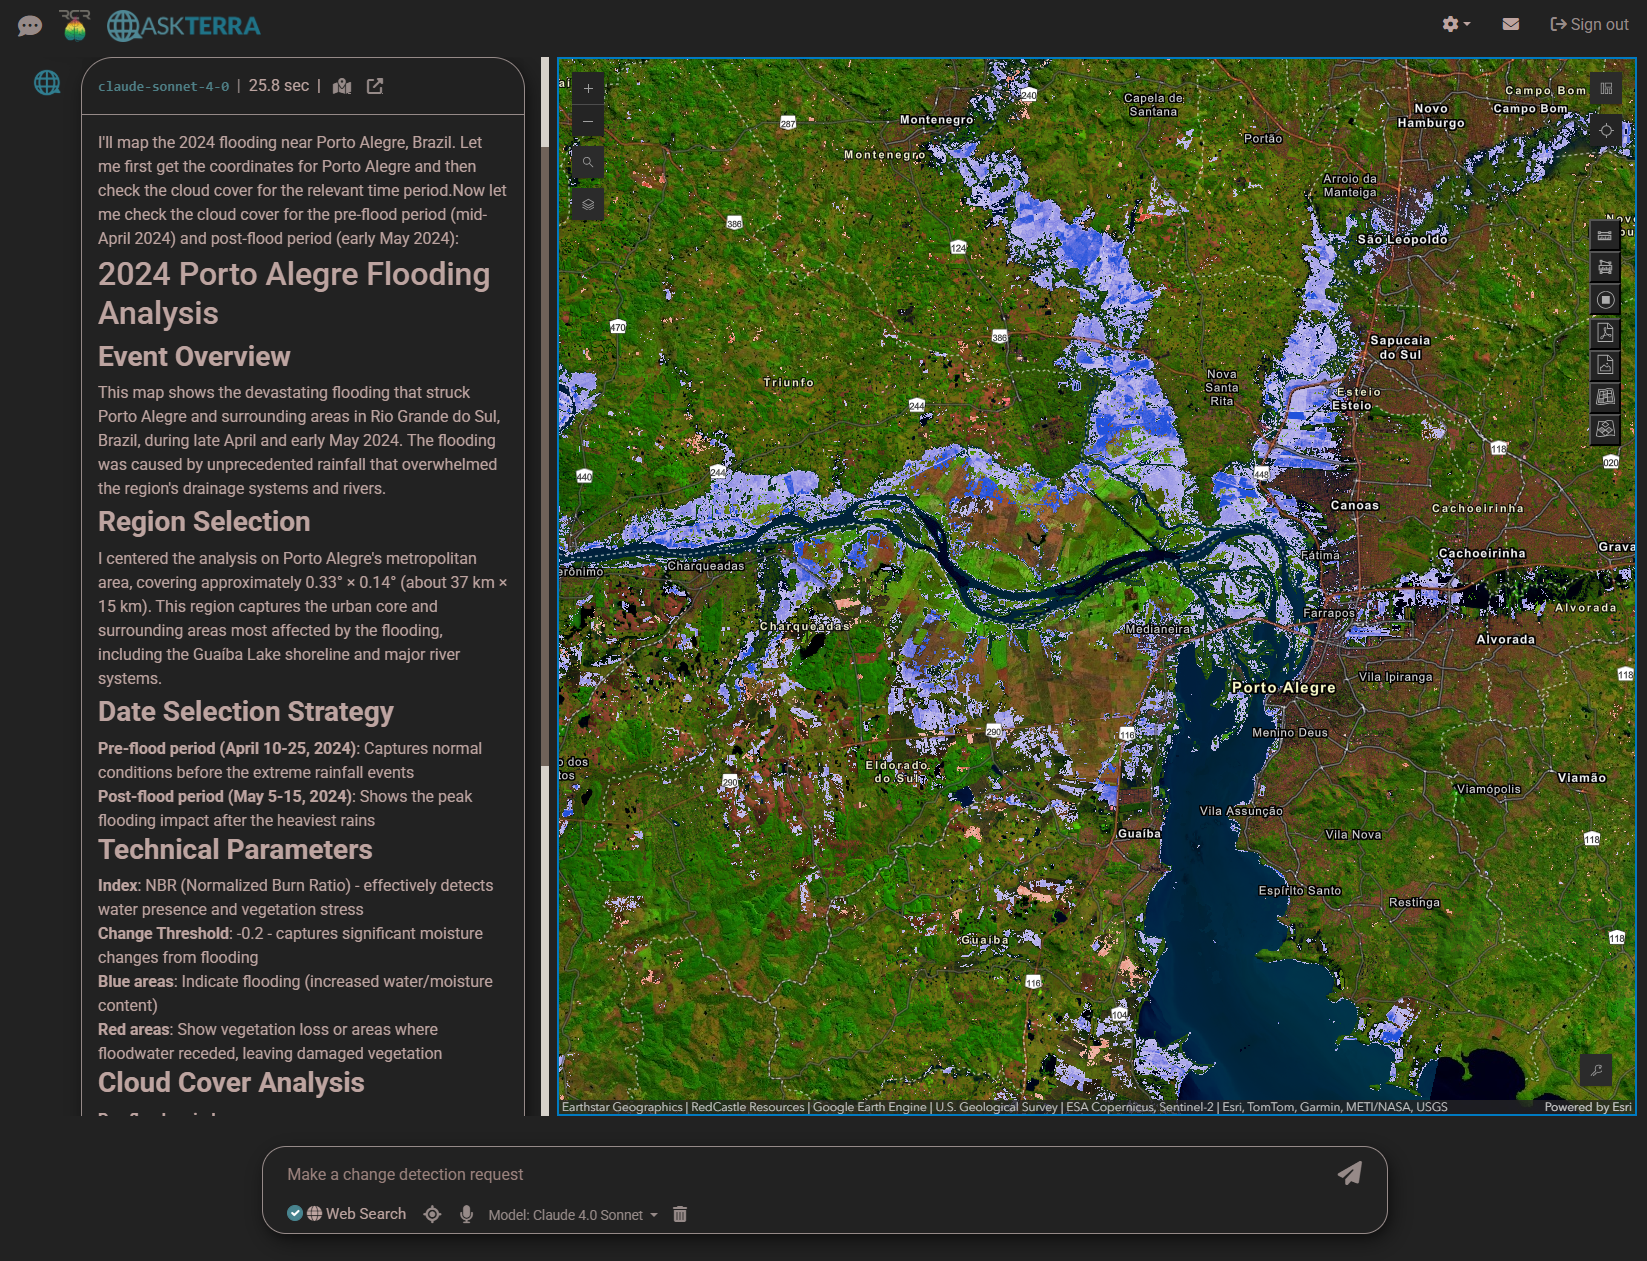
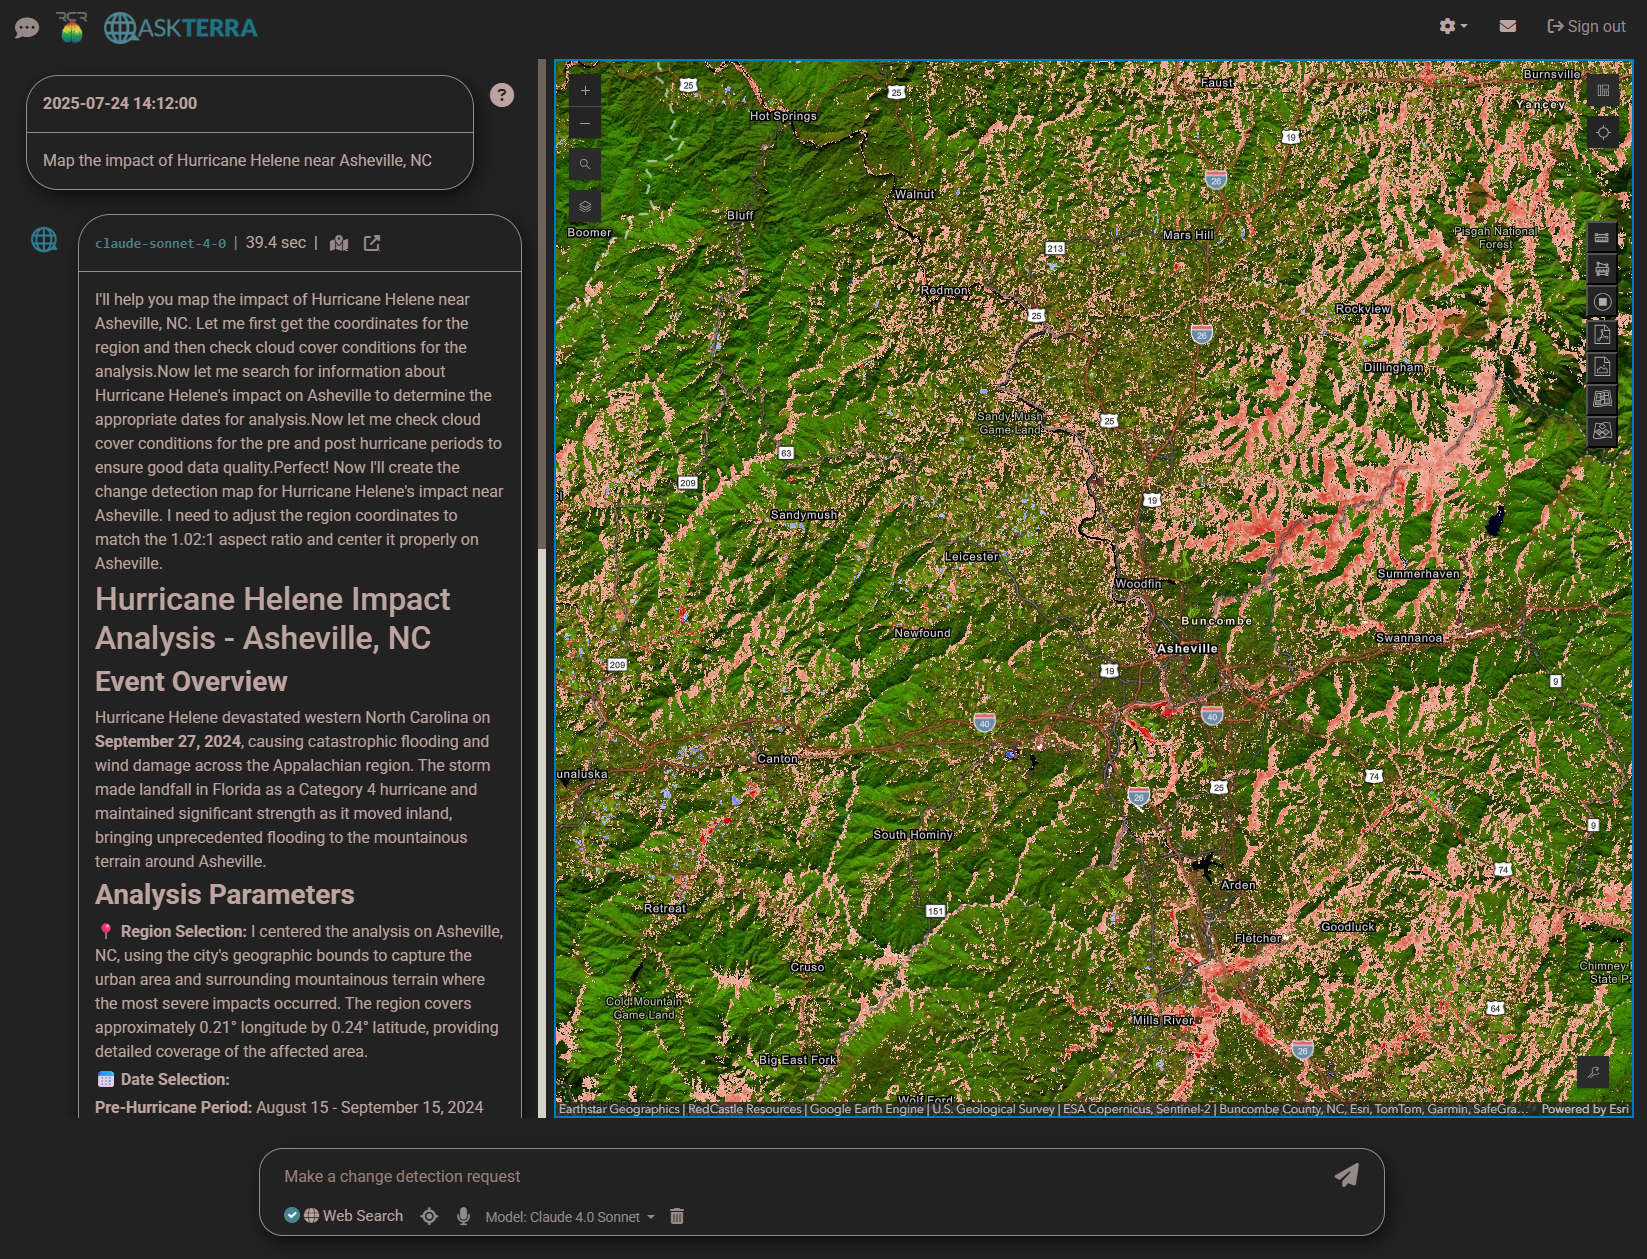
Example 1: Simple Query with minimal exploration (Low Cost): Asking "Map landscape change in Asheville, NC resulting from Hurricane Helene"
- Below you can see the textual answer and associate map displaying the free base map and the NBR Change Output:

- I then zoomed into the confluence of the Swannanoa and French Broad Rivers to examine the flood damage. I turned on both the pre-event sentinel composite and the post-event sentinel composite to explore the data and understand the change. This is illustrated in the image below.

The total cost in CDUs for this type of simple and focused query was 52.636 CDUs, see figure below for the breakdown:

Example 2: Interactive Exploration (Medium Cost): Now lets stay in the same query but zoom out and explore some other areas near Asheville that could have also been impacted from Hurricane Helene.
To save compute cost, I will turn off the pre and post imagery and just leave on the NBR difference layer and the base map will I explore the landscape, as illustrated below.

By exploring the Pisgah National forest to the Northeast of Asheville, we can see a lot of wind damage along the ridge lines and might want to take a closer look and view the pre and post composites again for another location.
During my exploration I zoomed into two separate locations to explore change on the landscape. In both instances I inspected the pre and post imagery composites to qualitatively check the logic. In one location I decided to create a PDF report to share with my colleagues summarizing the change in that location, see the report below.

By adding more exploration to my initial query I have increased the use of tile services by viewing the pre and post imagery in different locations and exploring a large area while displaying the NBR difference product. For this type or exploratory query you would expect to use \~ 130 CDUs, see figure below for the breakdown:

Now you might decide that you want to export the pre and post composites and the NBR difference layer as Geotiffs to do more analysis in your GIS.

Exporting the geotiffs will increase you total CDUs expended to \~175 CDUs, see figure below for the breakdown:

Example 3: Using the predictive capabilities of ASKTERRA (low/moderate cost): Alongside the core function of 2 date change detection, ASKTERRA leverages Google Deepminds Weather Next model (https://deepmind.google/science/weathernext/) to make weather forecasts 10 days into the future. ASKTERRA can display the 10 day forecasted Max Wind and Cumulative Precipitation globally. In addition we have created an associated “Gales Model” that predicts tree blowdown based on tree height and max windspeed.
Today is August 17, 2025. As we have an active hurricane in the Atlantic, I might be interested in its predicted path and associate max wind, cumulative precipitation and potential tree blowdown if I am managing assets on the east coast of the United States.
So with that in mind, lets ask, “Can you predict max wind speed in Florida for the next 10 days”.
Below you can see a zoomed out look at Hurricane Erin’s predicted path through displaying the Max Wind Speed layer. Predictive layers can be displayed as Max Wind Speed, Cumulative Precipitation and/or you can zoom into any land mass and explore potential for tree damage from wind.

- As you can see I zoomed out to get a more global perspective of Hurricane Erin’s max wind speed over the next 10 days. I also explored the cumulative precipitation at the same zoom level as seen in the graphic below:

For this type or forecasting query you would expect to use \~ 70 CDUs, see figure below for the breakdown:

In summary we hope that this provides you with all the information you need to choose the right ASKTERRA package that will support your GeoSpaital information needs. If you would like to discuss further or would like a live demo to explore ASKTERRA more before you decide please don’t hesitate to contact us at [email protected]